CBMM sized the AI bet at R$13 billion. Two billion of it is already in the ground.
Brazil produces 93 percent of the world's niobium and CBMM is the reason. The company has now put a six-year capital number on the oxide lines it says can serve AI data centers, and the 2026 tranche alone runs 82 percent above last year's.

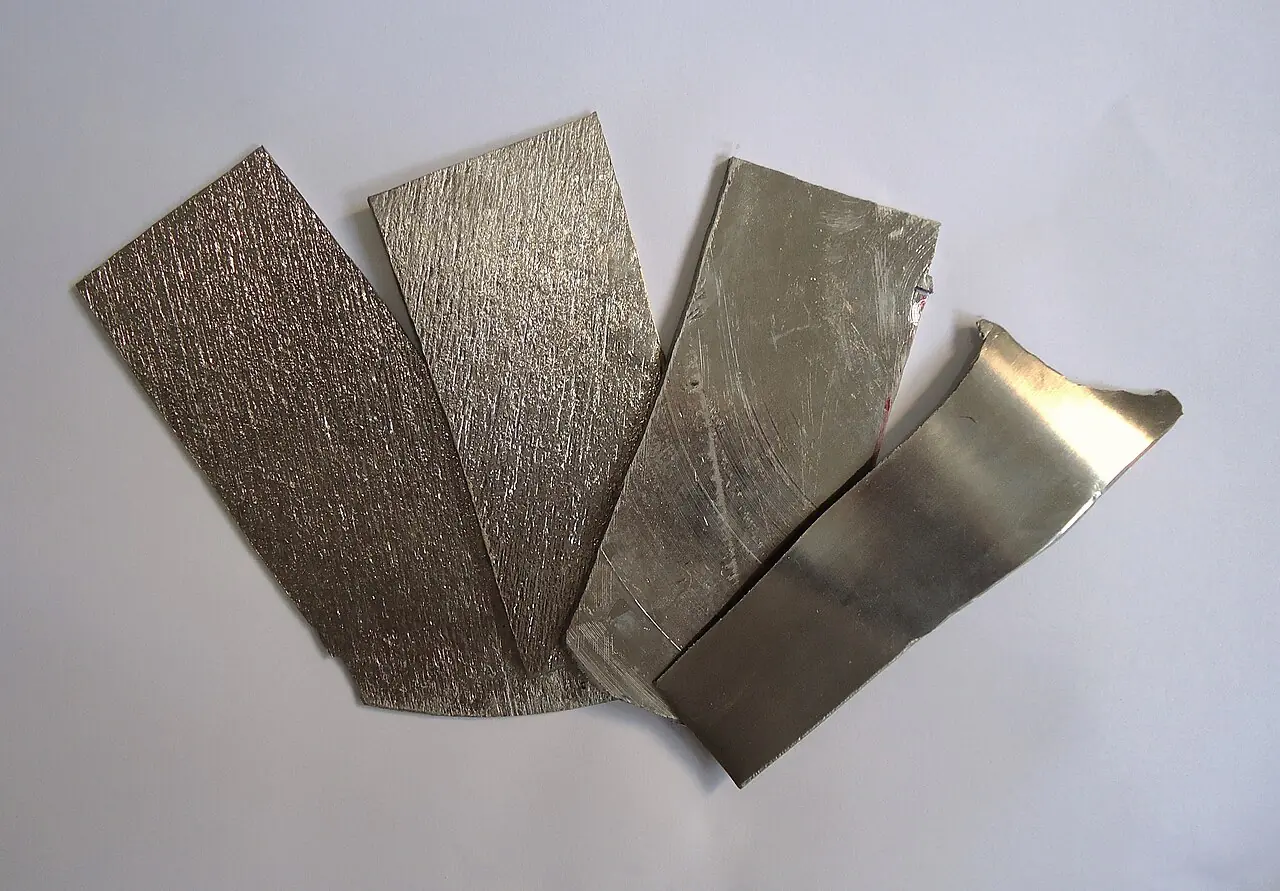
The world’s niobium monopolist has attached a number to a strategy it had been describing in adjectives. CBMM told Diário do Comércio it plans to invest around R$13 billion between 2026 and 2031 at Araxá, in Minas Gerais, and that R$2 billion of it has already been spent this year on new industrial lines and plants. Among the projects under way, in the company’s words, are “new lines for the production of niobium oxides,” usable in “electrification, batteries, optical components, electronics and technologies associated with data centers for artificial intelligence” [Diário do Comércio, September 18, 2026; Brasil Mineral, September 18, 2026].
One date note first. The disclosure is a September 18 company statement to Diário do Comércio, republished the same day by Brasil Mineral and picked up regionally on September 22. There was no press conference and no new project launch. What is new is the capital figure and the destination list, not an event.
What’s happening
- The R$13 billion is concentrated on three fronts: expansion of productive capacity, development of new materials and applications, and technology, innovation and infrastructure. R$2 billion has already gone into the Araxá complex in 2026 [Diário do Comércio, September 18, 2026].
- The oxide lines target electrification, batteries, optical components, electronics and AI data center technologies. This is a stated application target, not a disclosed offtake with a named buyer [Brasil Mineral, September 18, 2026].
- In 2025 CBMM passed 100,000 tonnes of ferroniobium equivalent sold for the first time, up 4.7 percent. Installed capacity is 150,000 tonnes a year against global demand of 133,000 tonnes [CBMM results release via IBRAM, March 25, 2026].
- 2025 financials: net revenue R$14.5 billion, up 8.3 percent; EBITDA R$10.2 billion; net income R$6.4 billion; capex R$1.1 billion. Steel is still 75 percent of revenue, with 25 percent from new materials [CBMM results release via IBRAM, March 25, 2026].
- The CBMM and Codemig partnership over the Araxá mines was renewed for 30 years with a possible 15-year extension, carrying it to 2070 [CBMM results release via IBRAM, March 25, 2026].
The arithmetic
Figures the company did not publish, computed by this desk. R$2 billion against R$1.1 billion of 2025 capex is an 82 percent increase in annual spend. R$2 billion of R$13 billion puts about 15 percent of the program in year one, and the R$11 billion balance across 2027 to 2031 averages R$2.2 billion a year, so 2026 is not a front-loaded spike but roughly the new run rate. R$13 billion is about 90 percent of one year of 2025 net revenue, which makes the program large but comfortably fundable from a business that produced R$10.2 billion of EBITDA. This is a company spending its own cash flow ahead of demand, not stretching a balance sheet.
Resist one comparison. In October 2025 CBMM told Reuters the plan was R$10 billion over five years [Reuters via InvestNews, October 29, 2025]. The new figure covers six years on a different scope, so it is not a clean 30 percent increase and the desk declines to report it as one.
Brazil angle
Brazil produced 104,000 tonnes of niobium content in 2025, about 93 percent of the 112,000 tonne world total, on reserves of 14 million tonnes [USGS Mineral Commodity Summaries 2026]. Note the unit trap: CBMM’s 100,000 tonne milestone is ferroniobium equivalent, the USGS figure is niobium content. Different measures, not to be netted.
The interesting part is the cushion. Capacity of 150,000 tonnes against 133,000 tonnes of global demand is roughly 13 percent of headroom, and 50 percent against CBMM’s own 2025 sales. The company is explicit that this is doctrine, describing investment ahead of market demand as securing supply as new markets develop [Brasil Mineral, September 18, 2026]. That is the rarest configuration on the critical minerals map: a chokepoint holder that is long capacity and building more, rather than rationing.
CBMM also confirmed it has no rare earth operation, and that Araxá studies have not shown economic viability at industrial scale, chiefly because treating the tailings would cost more than the contained rare earths are worth [Diário do Comércio, September 18, 2026]. Notable candor in a year thick with Brazilian rare earth announcements.
US angle
The United States has reported no significant niobium mine production since 1959 and has held 100 percent net import reliance every year from 2021 through 2025. Brazil supplies 67 percent of total US niobium imports and 89 percent of niobium oxide imports specifically, which is the fraction that matters for the electronics applications CBMM is tooling for. The Nebraska niobium, scandium and titanium project received a $10 million award in August 2025 from the US Department of War aimed at scandium alloy supply chain development, with expected spillover to niobium; once operational it would be the country’s only niobium mine and primary processing facility [USGS Mineral Commodity Summaries 2026]. Against a $525 million annual import bill, that award is a gesture toward optionality, not a supply chain.
China angle
Niobium inverts the usual dependency. China’s mine production was an estimated 40 tonnes in 2025 against Brazil’s 104,000, and China is simultaneously the largest customer for Brazilian output, taking 49 percent of ferroniobium exports under HS 7202.93, ahead of the Netherlands at 17 percent and Singapore at 9 percent. Brazil exported 92,000 tonnes in 2024 [USGS Mineral Commodity Summaries 2026]. Applying the USGS convention that ferroniobium is 65 percent niobium by weight, China’s share works out to roughly 29,000 tonnes of niobium content against 40 tonnes produced at home. That is desk arithmetic across a gross-weight figure and a share, so take it as an order of magnitude. The order of magnitude is the point, and it is why there is no niobium export-control clock to watch the way there is for rare earths, gallium and germanium. Beijing has no leverage on a material it does not produce and heavily imports.
What it means
The Tantalum AI Materials Index stood at 100.8 at the September 19 update, down 2.33 [Tantalum indexes, September 19, 2026]. Niobium sits in the index as an editorial proxy because the trade is private with no daily spot market, and this disclosure does not fix that. What it changes is the confidence interval on intent. This desk flagged in June that the open question was whether CBMM’s battery-grade oxide ramp could scale past pilot volumes; a six-year capital number with 15 percent already spent is a partial answer. The caveat is that a capital plan aimed at a list of applications is weaker evidence than a signed offtake. CBMM has named AI data centers as a destination in March and again in September, but has disclosed no customer, volume or delivery date. Capacity ahead of demand is the stated doctrine, which means the capacity becomes real before the demand is proven. This is the supply side positioning, not demand confirmed.
What to watch
- A named data center or electronics offtake from the new Araxá oxide lines. Application lists became capital in September; the conversion signal is a disclosed customer or volume. Silence through 2027 would mark the AI framing as aspirational.
- The 2026 full-year capex print, due with CBMM’s annual results around late March 2027. Actual capex near R$2 billion with 2027 guidance near R$2.2 billion keeps the program on its stated path. A material shortfall means R$13 billion was a ceiling, not a plan.
- Brazil’s ferroniobium export split. China took 49 percent in the last full USGS reading. Rising Netherlands and United States shares as the oxide lines come on would be the value-added shift appearing in trade data rather than in press statements.